This article was originally published on Search Engine Journal in March 2019.
https://www.searchenginejournal.com/a-technical-seo-guide-to-lighthouse-performance-metrics/292703/
Performance is money. We’ve all had it drilled into our heads: 7s page load means 26 percent session loss.
We’re learning more about the real-life human impact of our heft pages. ($0.11 to load a single page? What’s going on there, Canada!)
SEO professionals everywhere are collectively sighing over their personal and collective battles all with a unified blocker.
Yes, we want to make it faster, but how?
So Google gave us Lighthouse. Since its announcement at I/O 2016, the tool has grown from dev-centric to the recommended testing tool for the mobile-first index.
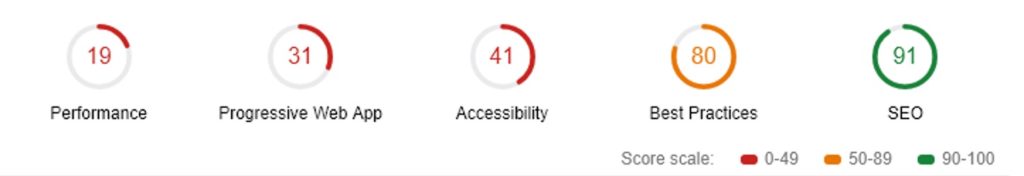
While the tool is convenient and easy to use, its scoring can be esoteric at best. The big color-coded overall performance metric is good for senior-level stakeholders and presentations.
To make real change, we need to look at what the metric’s composition. We need to understand how to act on the numbers.
We’re going to look at:
- How to test performance using Lighthouse.
- What metrics comprise Lighthouse’s Performance score.
- What those metrics mean.
- The “Explain Like I’m Five” (ELI5) version of metric definitions.
- Resources for improving your score.
How to Test Performance Using Lighthouse
Methodology Matters
Out of the box, Lighthouse audits a single page at a time. A single page score doesn’t represent your site. A fast homepage doesn’t mean a fast site.
Test multiple page types within your site. Identify your major page types, templates, and goal conversion points (signup, subscribe, and checkout pages).
Example Page Testing Inventory
| URL | Page Type |
| / | Homepage |
| /tools | Category Template |
| /tools/screwdrivers | Product Listing Page Template |
| /acme/deluxe-anvil | Product Detail Page Template |
| /cart | Cart |
| /checkout | Checkout |
| /order-confirmation | Order confirmation |
| /blog | Blog Root |
| /blog/roadrunners-101 | Blog Template |
Before you begin optimizing, run Lighthouse each of your sample pages and save the report data. Record your scores and the to-do list of improvements.
Prevent data loss by downloading the JSON results and utilizing Lighthouse Viewer when detailed result information is needed.
Get Your Backlog to Bite Back Using ROI
Getting development resources to action SEO recommendations is hard.
An in-house SEO could destroy their pancreas by having a birthday cake for every backlogged ticket’s birthday. Or at least learn to hate cake.
In my experience as an in-house enterprise SEO, the trick to getting performance initiatives prioritized is having the numbers to back the investment. This starting data will become dollars signs that serve to justify and reward development efforts.
Ways to Run Lighthouse
- Use the built-in functionality in Chrome Developer Tools.
- Download the Chrome extension (Not recommended. You can accomplish the same thing without installation using dev tools).
- Install and run the Node command line tool (Added bonus: Level up your automation by programmatically running Lighthouse tests using Node).
If you’re using options 1 or 2, open a new incognito mode window with all extensions disabled. Active extensions will skew your results. You want to measure performance against a new user experience without any cached assets.
Lighthouse Performance Metrics Explained
In version 3, Lighthouse’s performance score made of 5 weighted metrics. The most important is like your course final. Here they are in order, sorted by their impact on the overall score.
- Time to Interactive (weight: 5)
- Speed Index (weight: 4)
- First Contentful Paint (weight: 3)
- First CPU Idle (weight: 2)
- First Meaningful Paint (weight: 1)
Honorable mention: Estimated Input Latency data is available in the performance section but does not contribute to your score.
1. Time to Interactive (TTI)
TTI is the final exam of our performance score. The calculated metric was previously called Consistently Interactive. TTI measures the time it takes for three requirements to be first met.
Official Definition
The Time to Interactive (TTI) metric measures how long it takes a page to become interactive. “Interactive” is defined as the point where:
- The page has displayed useful content
- Event handlers are registered for most visible page elements.
- The page responds to user interactions within 50 milliseconds.
ELI5 TTI
I can see the content I want and complete an action without lag.
Seeing the content you want but not being able to do the thing you came to a site for is frustrating. This metric tries to quantify that experience.
The reality of TTI as a standardized metric: it doesn’t yet
The real Time to Interactive is a bit cerebral in documentation and IRL difficult to track from real users. Google hopes to create a standardized TTI metric in the future.
A Google doc linked from Lighthouse’s developer documentation states, “On a variability study of 100 popular sites, the recommended definition was stable 82% of the time.”
How to Get a Better TTI Score
This section could also be called “How to train unicorns for dressage”. While we can’t see TTI in the wild very well, we there are certain traits that highly correlate to unicorns TFI.
Three requirements that have to be met:
- First Meaningful paint: We have a whole section on this later.
- Actionable elements on the page are ready with the JavaScript that powers them (event handlers) ready.
- All the important scripts are done and won’t cause a delay in responding to user interaction.
JavaScript is a factor for all three of these conditions and is usually the culprit behind slow TTFI.
If a page is focused on downloading and executing JavaScript to render or make components on the page work, a user can’t interact yet.
If long tasks in queue are taking their time, the browser won’t be able to respond to user interactions in less than 50ms.
For a better score, deliver less script. Ideally, only what’s needed for the specific page being viewed.
Don’t deliver the same script more than once. Compress the scripts to send less information from your servers to the browser.
It’s time to work with your dev team. Start assessing JavaScript’s impact on your site with Chrome DevTools’ Timeline and JavaScript Profiler.
Resources for Improving TTI
- JavaScript Start-up Optimization
- Reduce JavaScript Payloads with Tree Shaking
- Reduce JavaScript Payloads with Code Splitting
Lighthouse Scores by TTI times
Wondering how fast TTI needs to be to get the coveted green? The endgame here is to create an interactive experience < 5s.
| Lighthouse Score | TTI (s) |
| 100 | 1.36 |
| 99 | 1.51 |
| 95 | 2.01 |
| 90 | 2.34 |
| 80 | 2.81 |
| 75 | 3.01 |
| 50 | 4.00 |
| 0 | 12.16 |
Improve Real User Measurement (RUM) TTI Tracking
Real user measurement (RUM) is important. As much hype as we hear about Lighthouse, the emulated data it provides might not capture real-world bottlenecks and can’t correlate against real-world page KPIs.
This code snippet uses Polyfill to detect TTI. Unfortunately, it’s currently a working draft with limited capability.
You’ll be able to track TTFI in the wild on devices using Chrome, Android Webview, or Chrome for Android. Alternatively, you can either track on First Input Delay for all users on JavaScript compatible browsers.
Tracking Time to First Interactive in Google Analytics
import ttiPolyfill from './path/to/tti-polyfill.js';
ttiPolyfill.getFirstConsistentlyInteractive().then((tti) => {
ga('send', 'event', {
eventCategory: 'Performance Metrics',
eventAction: 'TTI',
eventValue: tti,
nonInteraction: true,
});
});
If your audience is dominated by Chrome users, see full documentation here.
For everyone else, First Input Delay can be tracked in any JavaScript compatible browser. You’ll need to add a similar Google Analytics snippet.
2. Speed Index (SI)
Speed index is your performance midterm. Like Time to First Interactive, Speed Index is made of multiple data points.
Official Definition
Speed Index is a page load performance metric that shows you how quickly the contents of a page are visibly populated. The lower the score, the better.
Oof – that was vague.
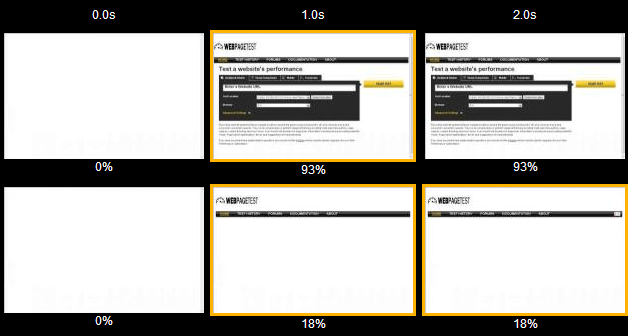
ELI5 SI
No one cares about whether content they can’t see has loaded.
This score represents how much is visible at a time during load. The Speed Index is the average time at which visible parts of the page are displayed.
Lighthouse’s Speed Index measurement comes from a node module called Speedline.
Speedline scores vary by the size of the viewport (read as device screen) and has an algorithm for calculating the completeness of each frame.
Lighthouse Scores by Speed Index Times
Our goal is to deliver a visual page (the above the fold content) in < 3s.
| Lighthouse Score | Speed Index (s) |
| 100 | 1.97 |
| 99 | 2.19 |
| 95 | 2.91 |
| 90 | 3.39 |
| 80 | 4.07 |
| 75 | 4.37 |
| 50 | 5.80 |
| 0 | 17.63 |
How to Get a Better Speed Index Score
Speed score reflects your site’s Critical Rendering Path.
A “critical” resource means that the resource is required for first paint or is crucial to the page’s core functionality.
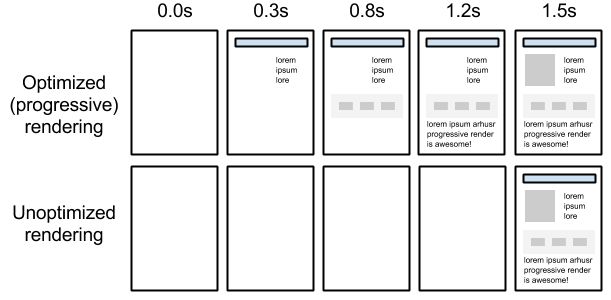
The longer and denser the path, the slower your site will be to provide a visual page. If your path is optimized, you’ll give users content faster and score higher on Speed Index.
How the Critical Path Affects Rendering
Lighthouse recommendations commonly associated with a slow Critical Rendering Path include:
- Minimize main-thread work.
- Reduce JavaScript execution time.
- Minimize Critical Requests Depth.
- Eliminate Render-Blocking Resources.
- Defer offscreen images.
ELI5 Fix: Again, JavaScript. Also, make third-party scripts asynchronous and cut the bot bait. Yes, every third-party tool thinks they should be loaded synchronously in the head for optimal performance.
Developer documentation for optimizing the critical rendering pathis bountiful. If you don’t have developers available and will have to be more hands-on, Google and Udacity have teamed up to offer a free course.
3. First Contentful Paint (FCP)
Finally, an easily observable metric!
Official Definition
First Contentful Paint (FCP) measures the time from navigation to the time when the browser renders the first bit of content from the DOM. This is an important milestone for users because it provides feedback that the page is actually loading.
ELI5 FCP
I can see the page I requested is responding. My thumb can stop hovering over the back button.
First Contentful Paint (FCP) vs. First Meaningful Paint (FMP)
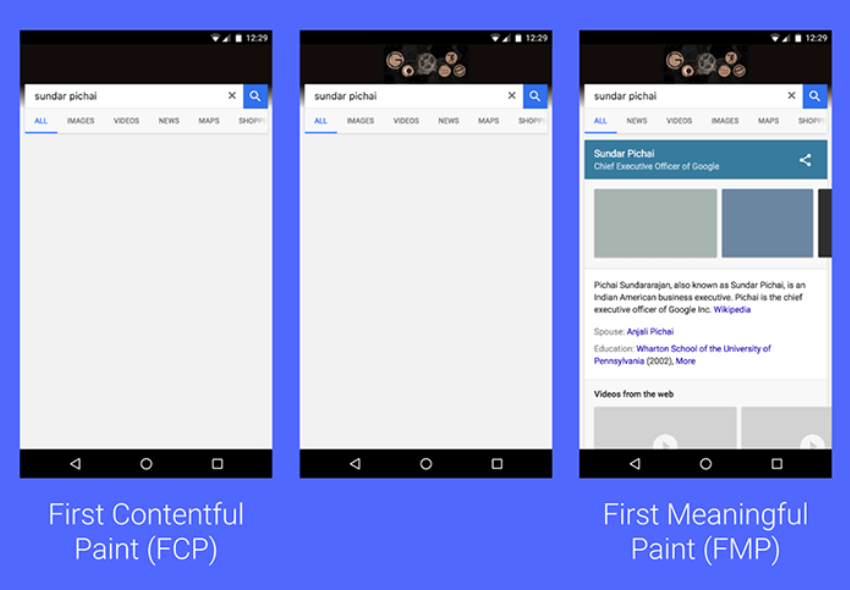
A user has a visual cue, such as a background and basic layout, that their request is receiving a response.
The metric reports the time when the browser first renders any text, image (including background images), non-white canvas or SVG.
Content generated via iFrames is excluded but text waiting on webfonts counts.
How Is First Contentful Paint Different Than First Meaningful Paint?
- First Contentful Paint: Something happened.
- First Meaningful Paint: The thing I came here for happened.
Lighthouse Scores by First Contentful Paint Times
Looking for the FCP needed to get a good score?
| Lighthouse Score | FCP (s) |
| 100 | 1.36 |
| 99 | 1.51 |
| 95 | 2.01 |
| 90 | 2.34 |
| 80 | 2.81 |
| 75 | 3.01 |
| 50 | 4.00 |
| 0 | 12.16 |
How to Get a Better FCP Score
In order for content to be displayed to the user, the browser must first download, parse, and process all external stylesheets it encounters before it can display or render any content to a user’s screen.
The fastest way to bypass the delay of external resources is to use in-line styles for above the fold content.
To keep your site sustainably scalable, use an automated tool like penthouse and Apache’s mod_pagespeed. These solutions will come with some restrictions to functionalities, require testing, and may not be for everyone.
Universally, we can all improve our sites time to First Contentful Pain by reducing the scope and complexity of style calculations.
If a style isn’t being used, remove it. You can identify unused CSS with Chrome Dev Tool’s built-in Code Coverage functionality.
Use better data to make better decisions. Similar to TTI, you can capture real user metrics for FCP using Google Analytics to correlate improvements with KPIs.
4. First CPU Idle
First CPU Idle was previously called Time to First Interactive (TTFI). In Lighthouse 3.0, they updated the name to more accurately describe how it works.
Official Definition
The First CPU Idle metric measures when a page is minimally interactive:
- Most, but maybe not all, UI elements on the screen are interactive.
- The page responds, on average, to most user input in a reasonable amount of time.
ELI5 First CPU Idle
I can interact with most of the loaded content. It might be a little laggy, but it works.
Simple, this metric is based on requirements like TTI. First CPU Idle and TTI both look for the JavaScript event handlers behind page functionality to be ready.
The difference is that First CPU Idle doesn’t require the browser to respond to user input in less than 50 milliseconds.
The far more interesting and complicated answer: First CPU Idle is calculated by combining lonely tasks and proportional leniency.
What Is a Lonely Task?
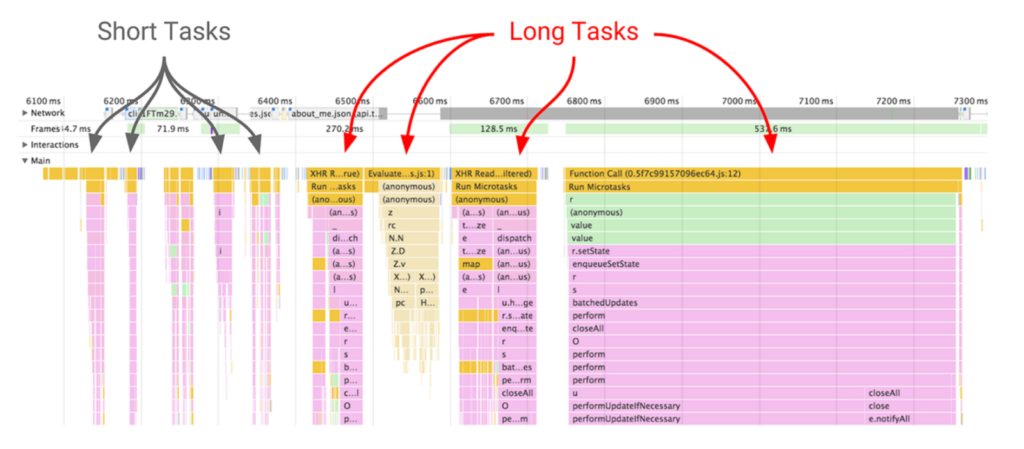
First, we need to understand what a long task is. Long tasks are those which take longer than 50ms. (Remember the TTI requirement?)
When a browser loads your site, there is essentially a single line queue of scripts waiting to be executing. Any input from the user has to go into that same queue.
When the browser can’t respond to user input because other tasks are executing, the user perceives this as lag.
Essentially long tasks are like that person at your favorite coffee shop who takes far too long to order a drink. Like someone ordering a 2 percent venti four pump vanilla five pump mocha whole fat froth, long tasks are a major source of bad experiences.
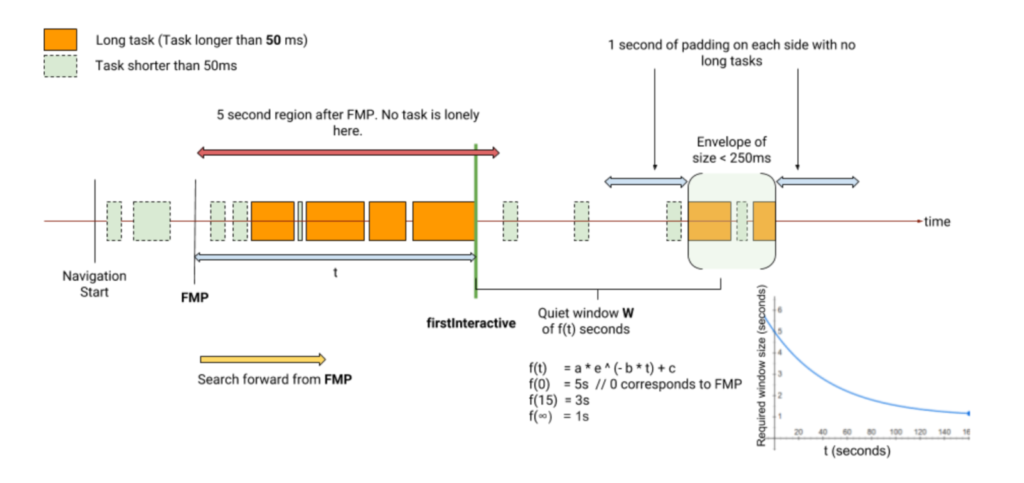
Lonely tasks are outlying long tasks created by isolated scripts that finish execution more than 5 seconds after FMP.
Think of them as someone who knew their complex coffee order was going to take a moment and decided to wait for a break in the rush.
A lonely task is padded with quiet windows. Lonely tasks are a marker that critical content and scripts have finished providing the user with an interactive experience.
“When the page is doing the most critical loading related tasks, the long tasks are usually densely packed. The isolated tasks are usually some third party ads or analytics script (and sometimes V8 GC tasks), and these should not block First Interactive – calling out the effect of these is the job of Consistently Interactive*.”
*Time to Consistently Interactive is called Time to Interactive (TTI). The doc still uses the old names.
What Is Proportional Leniency?
Ideally the later a task is executed, the less impact it has to the meaningful content of a page.
Proportional leniency measures the time the “initial flurry of loading activity to get a page minimally interactive” and the first 3-second “quiet window” in script execution.
Time to First Interactive Visualized
Think of it like coming into a restaurant after the lunch rush. Proportional leniency is looking for the first person to come in and get a table without having to wait in the lobby.
Lighthouse Scores by First CPU Idle Times
| Lighthouse Score | FCP (s) |
| 100 | 1.95 |
| 99 | 2.19 |
| 95 | 3.01 |
| 90 | 3.57 |
| 80 | 4.39 |
| 75 | 4.74 |
| 50 | 6.50 |
| 0 | 22.40 |
How to Improve Your First CPU Idle Score
Two strategies address the lion’s share of poor First CPU scores. Warning: you will need development resources to understand how these apply to your site.
- Minimize the number of required resources that must be downloaded and executed before a page can load
- Reduce the size of required resources
5. First Meaningful Paint (FMP)
Official Definition
First Meaningful Paint is the time when page’s primary content appeared on the screen. This is going to be our primary metric for user-perceived loading experience.
Definitions of primary content differ depending on pages. For blog articles, it would be the headline + above-the-fold text (and text must be visible — not waiting for fonts). For search engines, it would be search results. If an image is critical to the page (e.g., ecommerce product page), then first meaningful paint requires it to be visible. Paints with only the page header, navigation bar, or loading indicator such as spinner icon don’t qualify.
ELI5 FMP
I can see what I came here for!
FMP measures the first time users could start consuming page content. The lower your score, the faster user feels that the primary content of the page is visible.
The “most important parts” are sometimes called “hero elements”. Don’t read that as hero images (no one came to your page to see a stock photo).
Think of them as the reason the user came to your page. Like Time to First Interact, the hero elements necessary to track FMP aren’t standardized.
“First meaningful paint (FMP) is the metric that answers the question: “is it useful?”. While the concept of “useful” is very hard to spec in a way that applies generically to all web pages (and thus no spec exists, yet), it’s quite easy for web developers themselves to know what parts of their pages are going to be most useful to their users.”
Lighthouse Scores by FMP times
| Lighthouse Score | FMP (s) |
| 100 | 1.36 |
| 99 | 1.51 |
| 95 | 2.01 |
| 90 | 2.34 |
| 80 | 2.81 |
| 75 | 3.01 |
| 50 | 4.00 |
| 0 | 12.16 |
How to Get a Better FMP Score
The key to FMP is prioritizing the elements of your layout reflect why your users came. The more elements your page loads, the slower it loads.
Load the resources needed for your above-the-fold content before you load scripts necessary for offscreen elements.
Ditch the fancy fonts or include a fallback font. The faster your text is available, the quicker you’ll achieve First Meaningful Paint.
A more basic (but highly effective) strategy is to remove excess scripts where you can. Ask for fewer fancy features or customized elements.
Take a look at your external resources. Plenty of widgets and plugins add content to your site “to improve SEO.”
The longevity of our field and personal careers demands we focus on what humans care about and think about feature enhancements. Is it bot bait? Kill it.
You can directly tie improvements to a dollar value in Google Analytics with FMP tracking.
Conclusion
The complexity of performance metrics reflects the challenges facing all sites. We use performance metrics as a proxy for user experience – that means factoring in some unicorns.
Tools like Google’s Test My Site and What Does My Site Cost? can help you make the conversion and customer-focused arguments for why performance matters.
Hopefully, once your project has traction, these definitions will help you translate Lighthouse’s single performance metric into action tickets for a skilled and collaborative dev team (shout to Snowmass!).
Track your data and shout it from the rooftops. As much as Google struggles to quantify qualitative experiences, SEO professionals and devs must decode with how to translate a concept into code.
Test, iterate, and share what you learn! I look forward to seeing what you’re capable of, you beautiful unicorn.